library(tidyverse)
library(readxl)
library(skimr)
library(plotly)
library(gghighlight)
library(patchwork)
date_caption <- "9 janvier 2024"
source("tools/themes.R") # themes
source <- read_csv("posts/2025-01-21/data/antibes-animations-sportives.csv")
df <- sourceIntroduction
Analyse du nombre d’activités sportives répertoriées à Antibes Juan-les-Pins entre 2023 et 2020.
Résultats
L’année 2022 a été particulièrement active en terme d’activités sportives.
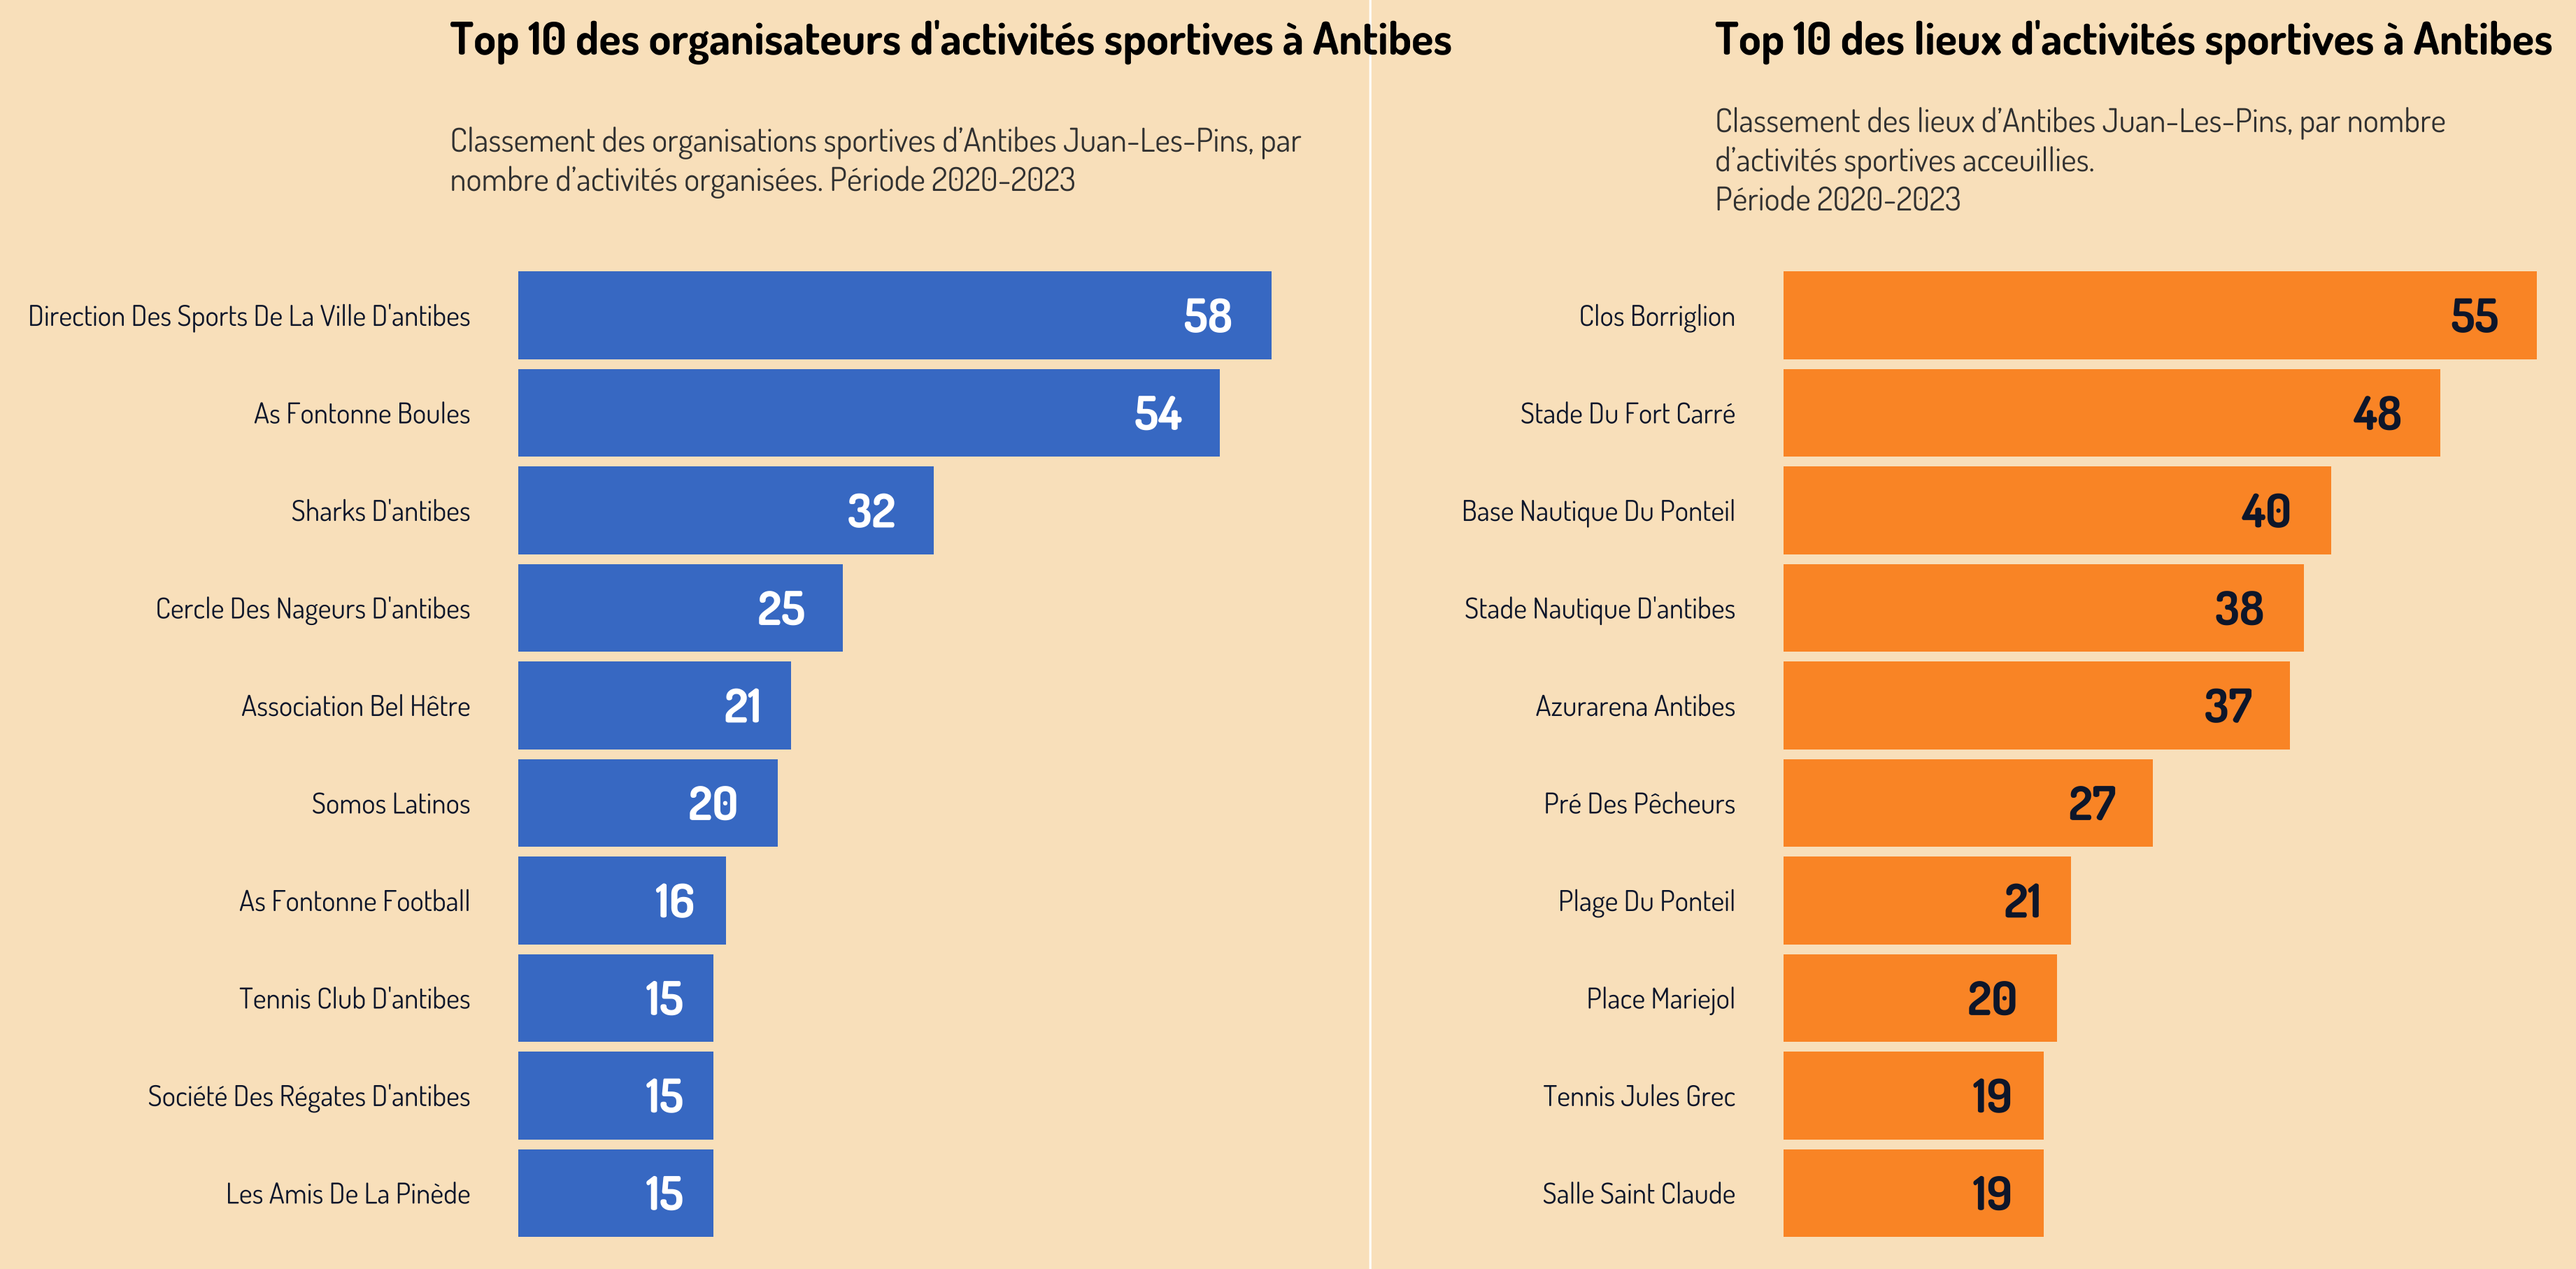
L’organisateur le plus actif est la Direction des sports de la ville d’Antibes.
Le lieux le plus actif est le Clos Borriglion.
Visualisation

Code
Import
Inspect
head(df)
unique(df$ORGANISATEUR)
colnames(df)
glimpse(df)
max(df$`DATE FIN`)Clean
# standardize cols names and variables in chr type
df <-
df %>%
rename_with(tolower) %>%
rename_with(~ str_squish(.)) %>%
rename_with(~ str_replace_all(., " ", "_")) %>%
mutate(across(where(is.character), ~ str_squish(str_to_lower(.)))) %>%
mutate(across(c(date_debut, date_fin), as.Date))
# drop NA
df <-
df %>%
drop_na(date_debut, date_fin, organisateur)
# check no NAs are remaining
skim(df)
# remove unwanted cols
df <-
df %>%
select(animations, date_debut, date_fin, organisateur, lieu_1)
# adding useful cols
df <-
df %>% mutate(yd = year(date_debut),
md = month(date_debut),
dd = day(date_debut),
yf = year(date_fin),
mf = month(date_fin),
df = day(date_fin),
yearmonth = paste0(yd,"-", md)
) %>% arrange(yd, md, dd) %>%
mutate(duration = (date_fin - date_debut)
)Further cleaning using OpenRefine
# save file for OpenRefine
write_csv(df, "posts/2025-01-21/data/animations.csv")
# load refined data
df_refined <- read_csv("posts/2025-01-21/data/animations_openrefined.csv")
# additional cleaning step
df_refined <-
df_refined %>%
mutate(organisateur = case_when(
organisateur %in% c("asf boules", "as fontonne boule") ~ "as fontonne boules",
TRUE ~ organisateur
))
# filter year
df_refined <-
df_refined %>% filter(yd > 2019)
# title case variables
df_refined <-
df_refined %>%
mutate(across(c(lieu_1, organisateur), str_to_title))df_refined# A tibble: 603 × 13
animations date_debut date_fin organisateur lieu_1 yd md dd yf
<chr> <date> <date> <chr> <chr> <dbl> <dbl> <dbl> <dbl>
1 bain du jo… 2020-01-01 2020-01-01 Day One Plage… 2020 1 1 2020
2 rencontre … 2020-01-04 2020-01-04 Badminton C… Gymna… 2020 1 4 2020
3 match pare… 2020-01-12 2020-01-12 Oajlp Handb… Salle… 2020 1 12 2020
4 ag wild mo… 2020-01-12 2020-01-12 Wild Move Base … 2020 1 12 2020
5 ski voile … 2020-01-16 2020-01-19 Société Des… Port … 2020 1 16 2020
6 19ème souv… 2020-01-19 2020-01-19 Antibes Vél… Parki… 2020 1 19 2020
7 rencontre … 2020-01-21 2020-01-24 Asf Hockey … Stade… 2020 1 21 2020
8 challenge … 2020-01-22 2020-01-22 Handisport … Salle… 2020 1 22 2020
9 sélection … 2020-02-01 2020-02-01 Oajlp Gymna… Salle… 2020 2 1 2020
10 top 12 gym 2020-02-08 2020-02-08 Oajlp Gymna… Foch 2020 2 8 2020
# ℹ 593 more rows
# ℹ 4 more variables: mf <dbl>, df <dbl>, yearmonth <chr>, duration <dbl>Analysis
# faceting : top organizers, locations, activities
orgs <-
df_refined %>%
count(organisateur) %>% arrange(-n)
orgs
lieux <-
df_refined %>%
count(lieu_1) %>% arrange(-n)
lieux
activities <-
df_refined %>%
count(animations) %>% arrange(-n)
activities
# Filter top 10 organisateurs
top_orgs <- orgs %>%
slice_max(order_by = n, n = 10)
# Filter top 10 lieux
top_lieux <- lieux %>%
slice_max(order_by = n, n = 10)
# Count
count.animations.year <-
df_refined %>%
count(yd)
count.animations.yearmonth <-
df_refined %>%
count(yearmonth)
# Averages
mean(df_refined$duration) # mean duration
skim(df_refined$duration) # other statsPlot
# Color
c_highlight <-"#1D6FA1"
## Col chart per month
df_plot.year.facet <-
df_refined %>%
group_by(yd, md, organisateur) %>%
count() %>%
mutate(yd = factor(yd, levels = c("2023", "2022", "2021", "2020")))
plot.year.facet <-
df_plot.year.facet %>%
ggplot(aes(x = md, y = n)) +
geom_col(fill = c_highlight, alpha = 0.6) +
geom_col(data = df_plot.year.facet %>% filter(yd == 2023), fill = c_highlight, alpha = 1) +
geom_text( # axis labels
data = data.frame(x = 12.9, y = seq(0, 40, by = 10)),
aes(x, y, label = y),
color = "black",
family = setfont,
hjust = 1,
vjust = -0.5,
size = 3.5
) +
geom_text(data = count.animations.year %>% filter(yd == 2023),
aes(x = 2, y = 34, label = paste0(n, " activités en 2023")),
family = setfont,
hjust = 0.3,
fontface = "bold",
color = c_highlight,
size = 6) +
geom_text(data = count.animations.year %>% filter(yd < 2023),
aes(x = 2, y = 34, label = paste0(n, " activités")),
family = setfont,
color = c_highlight,
hjust = 0.5,
alpha = 0.6,
size = 6) +
scale_x_continuous( limits = c(0, 13),
expand = c(0, 0),
breaks = seq(1, 12, by = 1),
labels = c("J", "F", "M", "A", "M", "J", "J", "A", "S", "O", "N", "D"),
) +
scale_y_continuous(expand = c(0, 0)) + #start axis origin at 0
facet_wrap(~yd, ncol = 1, strip.position = "left", scales = 'free_x') +
theme(legend.position = "none")
p <-
plot.year.facet +
labs(title = "Moins d'activités sportives à Antibes en 2023 par rapport à 2022",
subtitle = "Nombre d'activités sportives organisées à Antibes par mois et par années.",
caption = social_caption2) + tt2
# Bar charts for top 10s
# Plot for top 10 organisateurs
plot_orgs <- ggplot(top_orgs, aes(x = reorder(organisateur, n), y = n)) +
geom_bar(stat = "identity", fill = "#457ECD") +
geom_text(aes(label = n), hjust = 1.8, size = 8, family = setfont, fontface = "bold", color = "white") +
coord_flip() +
labs(
title = "Top 10 des organisateurs d'activités sportives à Antibes",
subtitle = "Classement des organisations sportives d'Antibes Juan-Les-Pins, par nombre d'activités organisées. Période 2020-2023",
caption = social_caption2
) + tt4
# Plot for top 10 lieux
plot_lieux <- ggplot(top_lieux, aes(x = reorder(lieu_1, n), y = n)) +
geom_bar(stat = "identity", fill = "#FC972F") +
geom_text(aes(label = n), hjust = 1.8, size = 8, family = setfont, fontface = "bold", color = darkblue) +
coord_flip() +
labs(
title = "Top 10 des lieux d'activités sportives à Antibes",
subtitle = "Classement des lieux d'Antibes Juan-Les-Pins, par nombre d'activités sportives acceuillies. <br>Période 2020-2023",
caption = social_caption2
) + tt4Render
plot_orgs 
plot_lieux 
p
Source
Manifestations sportives à Antibes Juan-les-Pins, disponible sur data.gouv.fr. Mise à jour du 9 janvier 2024.